
A core tenet to success in any endeavor is defining, collecting and analyzing core metrics. Incident Response teams can only develop plans that lead to success when it can be defined and metered. Understanding and collecting two key metrics can aid in defining, metering and reporting on success.
Metric #1 – Number of Investigations
The first number that needs to be gauged is how many investigations need to be conducted each month. We will label this variable n. To find this number, just run a report from monitoring tools that deliver alarms. In mature organizations this will be found simply in the SIEM once all events are aggregated there. The first time n is calculated, it will likely be a ridiculous number (some organizations find this to be in the millions.)
When an Alarm Isn’t
One of the problems with using alarm counts is that under-tuned reporting tools are generating a lot of noise. That is something that must be dealt with to lower n and improve success. Accept n as reality and create plans to reduce the noise from n as part of the larger strategy to operational success.
Investigation Categories
If possible, break n into categories. Good examples of categories are:
- Malware
- External Attack
- Insider Threat
- Policy Violation
- Denial of Service
Doing this allows reporting to be done at a more granular level. This type of categorization may be available in log aggregation tools. If not, building this out will eventually be a component of the success strategy.
Metric #2 – Time per cycle
The second metric that has to be understood for every n is how long and investigation of a given type takes. We will label this variable t and it is expressed in hours. The most direct method for gathering the time per investigative cycle (t) is to use a stopwatch as a responder does his/her work. A sample of 10 – 20 t entries will provide a good average t for calculations. This is the same approach used by the military, fire fighting and law enforcement to gauge performance.
Understanding Failure
In going through this exercise, it is common to find that a responder cannot in any amount of time successfully complete an investigation. This is caused by an operational gap that we will discuss in later entries. In each Investigation Category mark the percentage of n that end in failure. You will want to mark t as infinity for n that fails. Failure reports will be covered in a subsequent article.
Putting the Numbers Together
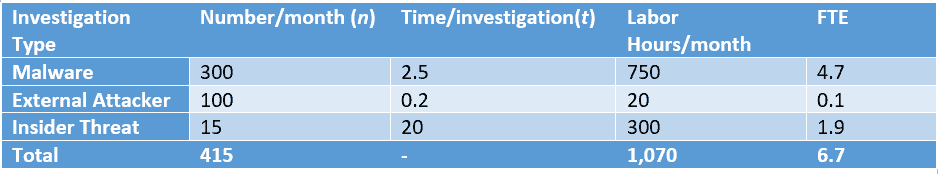
Once you have collected the number of investigations (n) and the time spent per investigation (t) it is time for spreadsheets. Multiplying n by t produces the number of labor hours per month (we’ll call that l.)
In the example below the organization needs to spend 1,070 labor hours per month. A full-time employee (FTE) works 160 hours per month. To calculate the number of responders this organization needs to complete all investigations, divide l by 160. (Note: If responders are required to spend time doing administrative or other duties, subtract those hours from 160.) Based on the example below, the organization needs 7 (6.7 rounded up) incident responders to execute the work required for success.
Wrap Up
The first step in building a successful incident response team is evaluating metrics for success. Most often these initial numbers are disheartening but understanding where an organization is allows for development of a plan toward success. In later articles, we will cover how to reduce n and t to improve security and operational success.