Testing provenance-graph intrusion detection on real data
WitFoo · Research by Ben Irvine ·
Summary
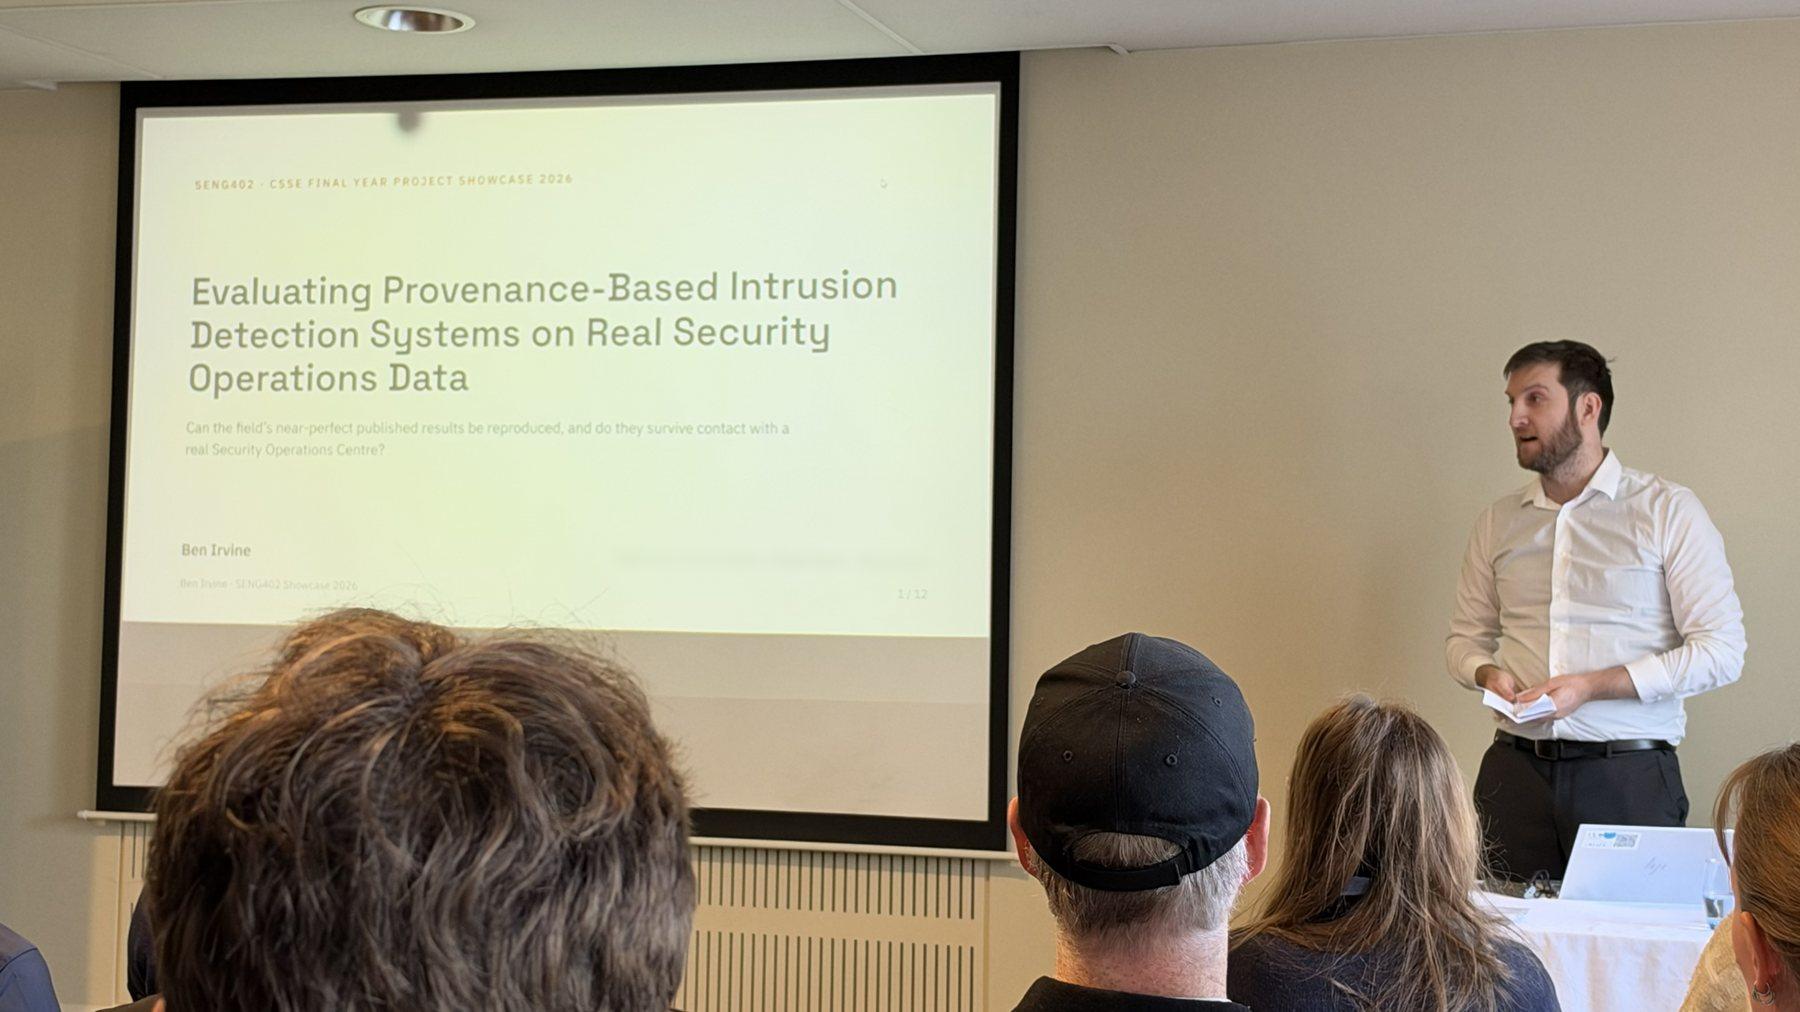
Four provenance-based intrusion detection systems that score well on research benchmarks did not hold up on one organization’s real security operations data. That was the finding of Ben Irvine’s 2026 final-year project at Te Whare Wānanga o Waitaha | University of Canterbury (UC). He ran each system through one standard framework, PIDSMaker, and asked two questions: can the published results be reproduced, and do they hold on the data a real security operations center (SOC) produces?
- Reproduction. NodLink, a recent system that reports precision 0.14 at full recall, averaged precision 0.0010 across ten runs of the framework’s reimplementation on the DARPA CADETS E3 benchmark. No threshold reached the published operating point, and a five-run reproduction by the framework’s own authors landed in the same range.
- Real data. On one organization’s day of enterprise telemetry from the Precinct 6 Cybersecurity Dataset, sampled to one benign event in eight and holding 54 labeled attacks, none of the four systems tested offered a usable operating point as configured. The one that caught all 54 raised 215,467 alarms, about 70 false alarms for every real one.
- What decided behavior. Threshold rules, data density and the shape of each attack mattered more than model architecture. With a threshold chosen perfectly in hindsight, NodLink held every attack within its top 0.7% of scores, needing 15 times fewer alarms than its own rule raised.
The attacks in that day are short scripted bursts, so the results describe how these systems behave on operational telemetry. They are not a final verdict on the systems against the long, multi-stage campaigns they are designed to catch.
The problem: results rarely checked on real data
Provenance-based intrusion detection systems (PIDS) publish strong results, but almost always from their own authors, on one family of curated benchmarks.
A PIDS builds a provenance graph, in which nodes are entities such as processes, files and network endpoints and edges are the interactions between them, then scores how anomalous the activity looks. The target is the advanced persistent threat: an attack that unfolds as a long sequence of individually unremarkable actions. In practice a PIDS is the last line of detection. Signature-based detection remains the mainstay of operational monitoring [4], and endpoint tools raise alerts by matching rules over known behaviors, with provenance analysis layered downstream [5]. A PIDS is there for the attacks those stages miss [3], [6].
That position makes two measures pull against each other. Recall (the share of attack activity flagged) is the risk a deployment carries; precision (the share of alarms that are real) decides whether the benefit survives triage, because alarms beyond an analyst team’s capacity are never looked at [2]. Low precision therefore erodes recall in practice.
The published evidence is thin on both counts:
- Results come almost exclusively from the DARPA Transparent Computing datasets, under evaluation conditions that are often not fully released [1], [2].
- A systematic attempt to reproduce eight deep-learning PIDS found none fully reproducible end to end [1].
- Evaluations on real industrial data report failure modes the benchmarks never surface, including poor portability between hosts and high false-positive rates as benign activity evolves [3]. Practitioners name imbalanced alarm-triage cost and excessive server memory among the gaps between research and deployment [6].
- Evasion research finds that attack-like and benign behavior separate only fragilely [7], [8], and synthesis work generates provenance graphs to make training data more representative [9]. A map of the whole field is in Inam et al. [10].
Ben’s project brings the systems to real data instead, using a publicly released operational dataset, ground truth for each incident, and one common framework, so that others can repeat the test.
Research questions
Ben asked whether published results reproduce, and whether they transfer to operational data.
| # | Question | What counts as an answer |
|---|---|---|
| RQ1 | Can the published results of provenance-based IDS be reproduced within a common framework, and what does reproduction depend on? | The paper’s metrics reproduced in the framework, run-to-run variance measured, and every configuration choice the result depends on documented |
| RQ2 | To what degree do these systems’ results hold on real industry data, and what determines their behavior there? | The same measurements for all four systems on the industry data, then a breakdown incident by incident |
Both questions use the framework’s standard metrics, plus two measures Ben added for operational data (false discovery rate and per-incident coverage):
- Precision, recall, F1 and false-positive rate over flagged entities.
- False discovery rate (FDR): the share of raised alarms that are wrong. At operational scale a tiny false-positive rate can still mean most alarms are false, and FDR is what an analyst working the queue experiences.
- Per-incident coverage: how many of the 54 incidents had at least one entity flagged, because totals can hide whole incidents being missed.
- Attack Detection Precision (ADP): a threshold-free measure of how well a system ranks attack entities above benign ones [2].
The systems tested
Four of the eight systems in PIDSMaker passed a screening run and were studied in full; each makes a different bet about what gives an attack away.
PIDSMaker implements eight provenance-based detectors in one pipeline, so differences in results come from the systems rather than from how data is loaded or scored [11]. Before touching the industry data, Ben ran each system once for 50 epochs on the DARPA CADETS E3 benchmark. A system was set aside if its mean ADP was 0.1 or lower both in his run and in the published five-run results of Bilot et al. [2], the second source guarding against a configuration error on his side.
Four of eight systems fell at or below the screening cut in both sources
Mean ADP on DARPA CADETS E3: Ben’s single 50-epoch run against the published five-run results of Bilot et al.
Ben Irvine’s report, Table I · mean ADP on CADETS E3, one 50-epoch run per system against Bilot et al.’s five runs
Flash, KAIROS, MAGIC and ThreaTrace were set aside; MAGIC also computes its detection threshold from the test data, which rules out a deployment-style evaluation. The four kept:
| System | Its bet | How it scores anomaly |
|---|---|---|
| NodLink [12] | Online detection under time and resource limits | A variational autoencoder; whatever the model cannot reconstruct is anomalous |
| ORTHRUS [13] | Temporal dynamics | A temporal graph network predicts interaction types; an interaction the learned dynamics find surprising is anomalous |
| Velox [2] | A lightweight model of the same kind | A linear encoder and a small neural network predict edge types, with no temporal machinery |
| R-CAID [14] | Root-cause identity | Rewires the graph so every node connects to its provenance roots, on the premise that where a chain started is the telling signal |
The data: a real SOC day, and a dataset that changed
Ben tested on the Precinct 6 Cybersecurity Dataset [15], and his findings led WitFoo to correct and regenerate it.
The dataset is security telemetry captured live from enterprise organizations in 2024, sanitized and published openly by WitFoo. Its labels record what the automated correlation engine in Precinct, the WitFoo platform that processed the capture (the product line is now WitFoo Analytics), attached to incidents. They are not analyst verdicts, so the ground truth is operational: an event counts as an attack when the engine attached it to an incident.
Two exports, two designs. Ben worked across two versions of the dataset.
- First export (about 2 million events, drawn from the original dataset). The studied organization’s attacks existed only in a multi-year archive, with no benign traffic captured over the same period. Ben shifted benign traffic in time to overlay the attacks, an artificial construction he kept as a baseline.
- Second export (the regenerated v2.0.0 dataset, revision f63ffdbc). After Ben reported this and other quality findings, WitFoo regenerated the dataset. It now holds an organization whose attacks occur inside its live benign traffic: a natural experiment with no manipulation. Its test day holds about 12 million events, 54 labeled attack incidents and 3,040 attack entities.
- Further fixes. Anomalies found during testing were reported to WitFoo; several were confirmed as real defects, about 15% duplicate incidents among them, and fixed in a later release (v2.1.0). The two exports also disagreed on the labels of 22 events, so Ben regenerated ground truth from each export’s own labels.
From the dataset to PIDSMaker. Ben built a translation pipeline that filters the export to one organization and writes the tables PIDSMaker reads, with each day declared for training, validation or testing.
- Graph mapping. The dataset labels events (the graph’s edges), while the systems judge nodes. Of three mappings Ben designed, he used the one that gives every event its own intermediary node carrying the event’s text and label. It keeps the text for featurization, gives ground truth event by event, and does not leak the answer through the graph’s shape, because benign and malicious events get identical structure. The other two mappings were compared on paper only.
- Per-incident ground truth. One file per attack incident, so detection can be checked incident by incident.
- Density sampling. The pipeline keeps one benign event in K, chosen deterministically by hash, and every attack event, so data volume can be varied while ground truth stays the same.
- Streaming. The export is read piece by piece, so memory use stays constant whatever its size.
What the attacks look like. Every one of the 54 attacks is a scripted burst lasting under ten seconds, with a single lifecycle stage and one event type. Clustering them on events, hosts, duration and timing (k-means, k = 2, silhouette 0.54) recovers exactly two shapes: 24 compact incidents involving two to five hosts, and 30 wide fan-out campaigns. All 202 distinct tokens that appear in attack events are also common in benign events, which gives text-based models little to work with. Nothing in the day resembles the long, multi-stage campaigns PIDS are built to catch.
How the evaluation was run
Every result was generated so that someone else could regenerate it exactly, and every comparison changed one thing at a time.
The experiments ran on UC’s shared research computing cluster, whose GPU nodes have memory ceilings of roughly 190 to 290 GB. That ceiling decided how much data any system could be tested on, so the industry results come at three scales:
| Scale | What it is |
|---|---|
| 2M | The first export, about 2 million events drawn from the original dataset |
| D8 | The second export’s test day, keeping one benign event in eight and every attack event |
| D4 | The same day, keeping one benign event in four and every attack event |
For the real-data experiments, the models trained on the organization’s two naturally attack-free days in the second export (about 99,000 events) and were tested on the day holding the 54 attacks. Each run then followed six stages: build graphs from the event tables, transform them where a system requires it, turn each node’s text into embeddings, batch for the GPU, train, and evaluate by scoring the test day, applying the system’s threshold rule and comparing the flagged set with ground truth.
- Reproducibility. Dataset revisions, random seeds and the full configuration of every experiment were fixed and kept under version control. Ben added per-epoch checkpointing and reseeded re-evaluation to the PIDSMaker fork, so a trained model can be handed over and checked rather than retrained.
- Result provenance. Every number was computed from the framework’s saved score files, not from run logs, and each file was checked against the known ground-truth counts (3,062 attack entities at 2M, 3,040 in the second export) before use.
- Model selection. PIDSMaker reports the epoch with the best score on the test data by default, which Ben treats as a form of test-set leakage. His real-data results use the final training epoch instead, with the best epoch shown only as a labeled oracle bound that no deployment could choose. The NodLink reproduction follows Bilot et al. in taking each run’s best epoch, which favors NodLink.
- Uncertainty. Precision and recall carry 95% confidence intervals from bootstrap resampling (20 resamples). Because NodLink samples at inference time, one trained NodLink model was also re-evaluated under ten evaluation seeds.
- A baseline. An Isolation Forest [16], [17], with no graph and no deep learning, scored each event on five features: source-host rarity, destination-host rarity, host-pair rarity, burst rate and time of day. Event type was left out because it almost reproduces the labels (every attack event carries the type EVENT, shared by only 0.4% of benign events). The baseline is a floor, not a competitor: it flags events while the PIDS flag nodes, so comparisons use equal alarm counts and only large differences are read.
Results
Neither question came out the way the published numbers suggest: NodLink’s result did not reproduce, and no system offered a usable operating point on the real day.
Reproducing NodLink (RQ1)
Across ten runs of PIDSMaker’s reimplementation of NodLink, in its published configuration on CADETS E3, mean precision was 0.0010 against the paper’s 0.14, two orders of magnitude lower, and mean recall was 0.825 against the claimed 1.0. The five-run reproduction by Bilot et al. [2], who built the framework, sits in the same range, with precision below 0.005.
- No threshold reaches the claim. A sweep over the saved scores found no threshold giving precision 0.14 and recall 1.0 together. The test day holds 68 attack nodes against 281,517 benign ones. Attack nodes score higher on average (1.18 against 0.16), but 2.6% of benign nodes score above the attack average and both reach the same maximum. The best point found was precision 0.375 at recall 0.088.
- Results swing between runs. With only the training seed changed, run-level ADP varied by a relative standard deviation of 73% (from 0.038 to 0.570 across ten runs), in line with the 56% in the published five runs. Re-evaluating one trained model under ten evaluation seeds left Velox and ORTHRUS identical but moved NodLink’s ADP between 0.278 and 1.000, while its precision and recall barely moved.
- The threshold rule matters as much as the model. Applying the framework’s three threshold rules to the same ten runs moves mean precision by two orders of magnitude and mean recall from 0.985 to 0.018.
| Threshold rule | Mean ADP | Mean precision | Mean recall | Mean true positives | Mean false positives |
|---|---|---|---|---|---|
| NodLink’s own rule (Grubbs, 90th percentile) | 0.265 | 0.0010 | 0.825 | 53.6 | 51,604 |
| MAGIC’s rule (test-set mean) | 0.165 | 0.0005 | 0.985 | 56.5 | 112,327 |
| Maximum validation loss | 0.253 | 0.131 | 0.018 | 0.8 | 12.6 |
Ben traces the gap to three different things sharing the name NodLink. Abrar et al. [1] found that NodLink’s released code counts every process node in cached subgraphs as a true positive, not only those in subgraphs that raised an alert, and evicts its cache by a different rule from the paper’s; they could not reproduce the DARPA results because the evaluation scripts and labels were not released. In Ben’s reading, the first difference inflates the reported precision. PIDSMaker, for its part, keeps only NodLink’s anomaly-scoring core, without the paper’s subgraph cache, Steiner-tree construction or investigation stage, so the framework’s numbers measure that core. In Ben’s assessment, no available implementation both runs on the benchmark and matches the paper’s description.
Ben’s answer to RQ1 is that the published result does not reproduce through the common framework, and that any reported number for this system is interpretable only alongside four choices: the threshold rule, the epoch reported, the training seed and, for NodLink, the evaluation seed.
Four systems on the real day (RQ2)
On the real day, no system offered a usable operating point as configured, and all four had screened at a best ADP of 0.70 to 0.90 on the benchmark.
| Scale | System | Alarms | True positives | Precision | Recall | F1 | ADP | Incidents caught (of 54) |
|---|---|---|---|---|---|---|---|---|
| 2M | NodLink | 23,603 | 3,062 | 0.130 | 1.000 | 0.230 | 0.198* | 54* |
| 2M | ORTHRUS | 13,253 | 2,868 | 0.216 | 0.937 | 0.352 | 0.243 | 51 |
| 2M | Velox | 77 | 0 | 0.000 | 0.000 | 0.000 | 0.177 | 0 |
| 2M | R-CAID | 5 | 0 | 0.000 | 0.000 | 0.000 | 0.137 | 0 |
| D8 | NodLink | 215,467 | 3,040 | 0.014 | 1.000 | 0.028 | 0.258 | 54 |
| D8 | ORTHRUS | 1,204 | 451 | 0.375 | 0.148 | 0.213 | 0.178 | 17 |
| D8 | Velox | 26,422 | 218 | 0.008 | 0.072 | 0.015 | 0.118 | 8 |
| D8 | R-CAID | 1 | 0 | 0.000 | 0.000 | 0.000 | 0.004 | 0 |
| D4 | NodLink | 590,336 | 3,040 | 0.005 | 1.000 | 0.010 | 0.136 | 54 |
| D4 | ORTHRUS | 0 | 0 | — | — | — | 0.095 | 0 |
Final training epoch, each system’s configured threshold rule. *The NodLink 2M run predates the split into 54 incidents, so its ADP uses a single-group mapping and its 54 of 54 follows from recall 1.0. Velox and R-CAID were not run at D4. Confidence intervals are in Ben’s report.
- No usable operating point. At D8, NodLink catches every attack by raising 215,467 alarms, a false discovery rate of 98.6%: an analyst would clear about 70 false alarms for every real one. ORTHRUS raises only 1,204 alarms at the best precision of the four (0.375) but reaches 17 of the 54 incidents; 37 attacks raise no alarm at all. Velox raises 26,422 alarms to touch 8 incidents, and R-CAID flags a single benign node.
- The best system depends on the alarm budget. At 272 alarms, Velox at its oracle epoch touches 41 of 54 incidents and the others almost none. At 1,204 alarms, NodLink leads the final-epoch systems with 29. At 26,422 alarms, NodLink covers all 54 and even R-CAID’s ranking reaches 30.
- The systems overlap. ORTHRUS detects every incident that final-epoch Velox detects, and adding ORTHRUS to Velox at their oracle epochs gains exactly one incident (41 to 42). Twelve incidents are caught by nothing except NodLink’s flood, so deploying several of these systems together would add almost nothing over the best one.
- Attack shape predicts detection. Velox’s detections fall only among the wide campaigns, none among the compact incidents, and the two shapes also predict where R-CAID ranks attacks. For ORTHRUS they predict nothing: its detections split almost evenly between the two shapes. In Ben’s analysis, which attacks are detectable is largely a property of the attack, not the system.
- Some detections are close to arbitrary. ORTHRUS gives its 2.08 million nodes only 183 distinct scores, with one tied block holding 62% of all nodes, and Velox behaves similarly. Two near-identical incidents (73 and 74 events, the same two hosts, nine seconds each, 24 seconds apart) landed at the 99.98th percentile, detected, and the 64.4th, missed; nothing about the attacks predicts which.
- Density changes behavior, not just numbers. NodLink’s flag count grows with data volume (23,603 at 2M, 215,467 at D8, 590,336 at D4), so recall holds at 1.0 while the false discovery rate climbs from 87.0% to 98.6% to 99.5%. ORTHRUS goes from near-full recall at 2M (0.937, 51 of 54 incidents) to 0.148 (17 of 54) at D8, and to no alarms at all at D4.
- Training content matters more than labels. Adding two former attack days to training, with their malicious events removed, destabilized ORTHRUS, and the collapse persisted when the larger set was sampled back to the original volume. Ben’s result suggests that, for a deployment, cleaning the attacks out of a day may not be enough: the day may need never to have contained them.
- A simple baseline sets a high floor. The Isolation Forest’s own rule flags 5.8 million events, nearly half the day, and even a perfect threshold needs 5% of the day’s 12 million events for full recall, at precision 0.005, so the attacks are not trivially catchable by a simple detector upstream, which Ben takes as showing the day is a fair test. At a matched budget of 26,422 flags, though, the baseline covers 39 of 54 incidents, more than ORTHRUS (21), R-CAID (30) or final-epoch Velox (8) at the same budget. It catches 29 of 30 wide campaigns but only 10 of 24 compact incidents, whose few events pass between hosts that already talk routinely. Only NodLink, at 54 of 54, clearly beats it.
Rankings and rules fail separately. Given a threshold chosen perfectly in hindsight (the rank of its last attack node), NodLink’s ranking holds every attack within its top 0.7% of nodes at D8: 14,395 alarms at precision 0.211, against 215,467 alarms at 0.014 from its own rule. Fifteen times the necessary alarms at D8, and 23 times at D4, come from the rule rather than the ranking.
The NodLink rule raises 15 times the alarms its ranking needs
D8 test day, final epoch. The other three rules stop far short of what their rankings need for full recall.
Ben Irvine’s report, Table V · D8, final epoch · configured rule against the minimum cost of recall 1.0
The other three fail differently. Velox’s rule swings between adjacent epochs (at 2M, from about 13,800 flags to 64) while its ranking barely moves; ORTHRUS’s rule cannot reach a ranking that needs about a third of the graph for full recall; and R-CAID’s single-flag rule sits on a near-random ranking that no rule could rescue.
Ben’s answer to RQ2 is that the benchmark results do not transfer to this operational data. Three things the papers treat as fixed decide behavior: the threshold rule, which fails in all four systems; the density of the data; and the match between each system’s bet and the shape of the attacks.
What Ben recommends evaluations report
- Ranking quality and the cost of recall, separately from the threshold rule. A deployment could then keep a system’s ranking and set its own rule; for NodLink, a cut placed perfectly in hindsight would raise precision at full recall from 0.014 to 0.211. Scale-sensitive rules, such as quantile cuts, should be anchored to score space before any cross-dataset comparison.
- The final training epoch, with any best-epoch figure labeled as an oracle bound.
- Ranking metrics over tied scores, with caution. Within a tied block the order is arbitrary, so ADP partly measures a shuffle: the same ORTHRUS model, day and scores gave ADP anywhere from 0.998 to 0.243, depending only on evaluation granularity and how ground truth was grouped.
Limits of the study
Ben bounds his own conclusions, and the most important bound is the data.
- The attacks are short. Every one of the 54 attacks is a scripted burst under ten seconds, with one lifecycle stage and one event type, and nothing resembles the multi-stage, low-and-slow campaigns PIDS are designed for. The results describe how these systems behave on operational telemetry, not their value against the threats they target. A PIDS earns its place by catching attacks visible only in context, and a day whose attacks a per-event detector largely reaches cannot measure that; the compact incidents, which the baseline buries and ORTHRUS partly recovers, are the one place it shows.
- The ground truth is operational. Labels record the correlation engine’s own verdicts rather than analyst-confirmed findings, so any systematic blind spot in the engine would be invisible.
- One run per real-data result. The bootstrap intervals cover sampling variance, not training variance, and ORTHRUS is demonstrably nondeterministic from run to run. Cross-system conclusions therefore rest on differences far larger than the observed instability.
- One early run is not comparable. The NodLink run at 2M predates the split into 54 incidents, so its per-incident figures cannot be compared at that scale.
- The baseline flags a different population. It flags events while the PIDS flag nodes, so only large differences between them are read.
- Scope. RQ1 is answered in full for one system on one benchmark, with no claim about the seven systems only screened. RQ2 is answered for one organization’s test day at three densities.
What comes next
Ben’s report names five next steps, each of which extends the test the same data now makes possible.
- A second organization. The export holds another organization with no clean history, which would test the finding that training days must never have contained attacks.
- The full test day. The unsampled day (12 million events) needs more memory than the cluster’s nodes provide.
- The other mappings. The two graph mappings compared only on paper remain to be tested against the one used.
- Checkpointing upstream. The per-epoch checkpointing added to the PIDSMaker fork is a candidate contribution back to the framework.
- From detection to investigation. Comparing the subgraphs each system flags with the incident case graphs in Precinct would extend the evaluation to investigation, the stage the framework currently leaves out.
About the project
Ben Irvine carried out this research as his final-year software engineering project at UC in 2026, supervised by UC staff. He worked from WitFoo’s open data rather than a sponsorship, evaluating research provenance-graph intrusion detection systems on the Precinct 6 Cybersecurity Dataset, which WitFoo produced in collaboration with UC’s Computer Science and Software Engineering department. WitFoo answered his questions about the data and corrected the dataset in response to his findings; the design, experiments and analysis are his.
This article summarizes the research sections of his report, Reproducibility and Generalisability of Provenance-Based Intrusion Detection Systems on Real SOC Data, and is published with his permission.
“Over the project I suggested ways the dataset could better reflect the environments these systems would actually run in, including having attacks sit naturally among the normal activity around them. WitFoo checked and acted on every suggestion, rebuilding the dataset and making it possible to evaluate these systems on real operational data,” said Irvine.
References
Source report: B. Irvine, Reproducibility and Generalisability of Provenance-Based Intrusion Detection Systems on Real SOC Data, final-year project report, Department of Computer Science and Software Engineering, University of Canterbury, 2026.
- T. Abrar, A. Shamail, M. J. Iqbal, A. Ahmed et al., “On the reproducibility of provenance-based intrusion detection that uses deep learning,” ACM Conference on Reproducibility and Replicability (ACM REP), 2025.
- T. Bilot, B. Jiang, Z. Li, N. El Madhoun, K. Al Agha, A. Zouaoui and T. Pasquier, “Sometimes simpler is better: a comprehensive analysis of state-of-the-art provenance-based intrusion detection systems,” USENIX Security Symposium, 2025.
- Y. Xiao, L. Jiang, S. Nie, D. Li, S. Wu, K. Xu and Q. Li, “How far should we need to go: evaluate provenance-based intrusion detection systems in industrial scenarios,” arXiv:2603.22982, 2026. arxiv.org/abs/2603.22982
- R. Sommer and V. Paxson, “Outside the closed world: on using machine learning for network intrusion detection,” IEEE Symposium on Security and Privacy, 2010.
- W. U. Hassan, A. Bates and D. Marino, “Tactical provenance analysis for endpoint detection and response systems,” IEEE Symposium on Security and Privacy, 2020.
- F. Dong, S. Li, P. Jiang, D. Li, H. Wang, L. Huang, X. Xiao, J. Chen, X. Luo, Y. Guo and X. Chen, “Are we there yet? An industrial viewpoint on provenance-based endpoint detection and response tools,” ACM Conference on Computer and Communications Security (CCS), 2023.
- A. Goyal, X. Han, G. Wang and A. Bates, “Sometimes, you aren’t what you do: mimicry attacks against provenance graph host intrusion detection systems,” Network and Distributed System Security Symposium (NDSS), 2023.
- K. Mukherjee, J. Wiedemeier, T. Wang, J. Wei, F. Chen, M. Kim, M. Kantarcioglu and K. Jee, “Evading provenance-based ML detectors with adversarial system actions,” USENIX Security Symposium, 2023.
- Y. Huang, S. Li, Y. Guo, X. Chen, W. U. Hassan and D. Li, “No data? No problem: synthesizing security graphs for better intrusion detection,” arXiv:2506.06226v4, 2026. arxiv.org/abs/2506.06226
- M. A. Inam, Y. Chen, A. Goyal, J. Liu, J. Mink, N. Michael, S. Gaur, A. Bates and W. U. Hassan, “SoK: history is a vast early warning system: auditing the provenance of system intrusions,” IEEE Symposium on Security and Privacy, 2023.
- T. Bilot, B. Jiang and T. Pasquier, “PIDSMaker: building and evaluating provenance-based intrusion detection systems,” arXiv:2601.22983, 2026. arxiv.org/abs/2601.22983
- S. Li, F. Dong, X. Xiao, H. Wang, F. Shao, J. Chen, Y. Guo, X. Chen and D. Li, “NodLink: an online system for fine-grained APT attack detection and investigation,” Network and Distributed System Security Symposium (NDSS), 2024.
- B. Jiang, T. Bilot, N. El Madhoun, K. Al Agha, A. Zouaoui, S. Iqbal, X. Han and T. Pasquier, “ORTHRUS: achieving high quality of attribution in provenance-based intrusion detection systems,” USENIX Security Symposium, 2025.
- A. Goyal, G. Wang and A. Bates, “R-CAID: embedding root cause analysis within provenance-based intrusion detection,” IEEE Symposium on Security and Privacy, 2024.
- WitFoo, Inc., “Precinct 6 Cybersecurity Dataset,” Hugging Face, 2026 (witfoo/precinct6-cybersecurity-100m). Ben’s first experiments used an export drawn from the original dataset, since replaced; his main experiments used the regenerated v2.0.0 release, revision f63ffdbc.
- F. T. Liu, K. M. Ting and Z.-H. Zhou, “Isolation forest,” IEEE International Conference on Data Mining (ICDM), 2008.
- F. Pedregosa, G. Varoquaux, A. Gramfort, V. Michel, B. Thirion, O. Grisel et al., “Scikit-learn: machine learning in Python,” Journal of Machine Learning Research, vol. 12, pp. 2825–2830, 2011.
How this paper was produced
WitFoo uses artificial intelligence tools to assist with research, fact-checking, and editing in the preparation of this paper. The research it describes is Ben Irvine’s; this account of it is WitFoo’s. WitFoo reviewed every claim, checked every source, and takes full responsibility for the content. Nothing in this paper was generated without human direction and review. The views expressed represent WitFoo’s perspective and constitute WitFoo’s intellectual property. © 2026 WitFoo, Inc. All rights reserved.